How Fuel Prices Move Used Vehicle Values — and How to Track It in MMR

Fuel prices really do reprice a lot, but not evenly, not immediately, and not symmetrically. What actually moves, how long it takes to reach the block, and the four numbers to watch so you find out from your own data instead of from a bad appraisal.
The relationship is real, and almost everyone models it wrong
When fuel gets expensive, big thirsty vehicles get cheaper. Everybody in the business knows this. The 2008 spike and the 2022 spike both demonstrated it clearly enough that nobody argues about the direction.
What people get wrong is everything else: how big the move is, which vehicles it touches, how long it takes, and whether it comes back. Those four are where money is actually made or lost, and none of them is intuitive.
This is not a piece about what fuel costs today. It is about the mechanism, because the mechanism is stable and the price is not — and because the only number that matters for your lot is the one you measure in your own segments, not one you read in an article.
Nothing happens on the day
The single most expensive mistake is treating a pump price move as though it reprices inventory that week. It does not. There is a chain, and each link takes time.
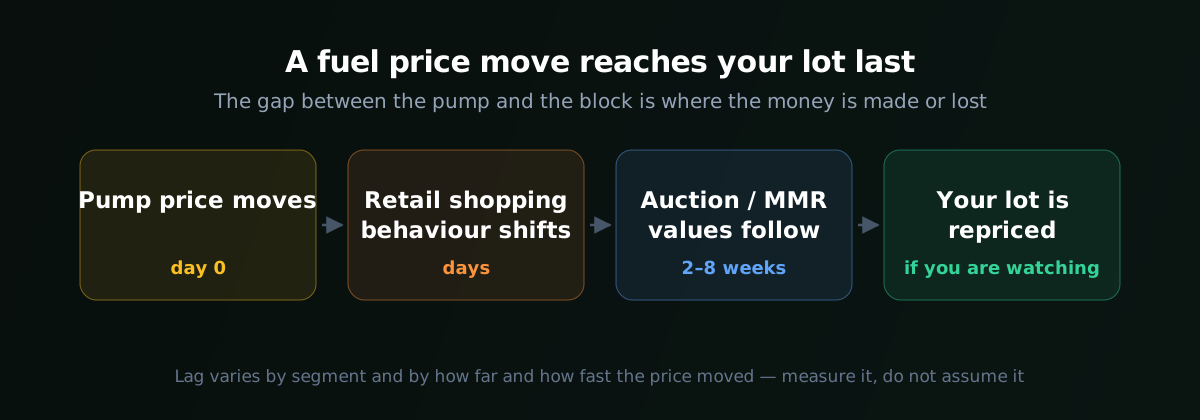
Retail intent moves first, and fast. Shoppers change what they search for within days. A household that was cross-shopping a full-size truck starts looking at a mid-size one. Nothing has been bought yet, and no published value has changed.
Retail transactions follow. People who were already in-market complete or abandon purchases over the following weeks. Days-to-turn on the affected segments starts drifting before any price does.
Wholesale follows retail. Dealers who are struggling to move a segment stop buying it, and the ones holding too much of it start dumping. Only now do auction values move — and published market values are backward-looking by construction, because they are built from sales that already happened.
Your lot moves last, unless you were watching the earlier links.
That ordering is the actionable part. By the time a segment's published value has visibly dropped, the repricing has already happened to you. The dealers who come out ahead are reading days-to-turn and retail asking prices, which move first, rather than waiting for the value guide to confirm what it can only tell them late.
What actually moves, and what does not
"Fuel-thirsty vehicles drop" is too coarse to trade on. The response is concentrated and very uneven.
Most sensitive — full-size SUVs and half-ton and larger trucks bought for personal use, plus performance vehicles with poor economy. These are the ones where a monthly fuel bill is a real share of the cost of ownership and where a buyer has an obvious cheaper substitute.
Barely sensitive — work trucks. This is the one that surprises people. A contractor who needs a three-quarter-ton to tow does not have a substitute. Demand is close to inelastic, and the values behave far more like a commercial equipment market than a consumer one. Discounting a work truck because fuel got expensive is leaving money on the table.
Moves the other way — hybrids and efficient compacts, which get bid up. The gain here is usually smaller in dollar terms than the loss on the truck side, but on a percentage basis it can be sharp, because the supply of used hybrids cannot expand quickly.
Complicated — EVs. The naive read is that expensive fuel helps EV values, and directionally it does. But EV pricing is dominated by other forces — new-model price cuts, incentive changes, battery warranty age, charging access — that routinely swamp the fuel effect entirely. Do not attribute an EV price move to fuel without ruling those out first.
Segment matters more than the headline. Two vehicles with similar fuel economy can behave completely differently depending on whether their buyers have a substitute. Substitutability is the real variable; fuel economy is just a proxy for it.
The asymmetry nobody prices in
Values fall faster on the way up than they recover on the way down.
When fuel spikes, dealers who are long the wrong segment sell into a market that has already turned, and the drop is quick. When fuel falls back, buyers do not return at the same speed — the memory of the spike lingers, and anyone who just got burned on a fuel bill is slower to commit than they were to flee.
The practical consequence: a segment that dropped sharply may take substantially longer to come back than it took to fall, and holding through the dip in expectation of a fast recovery ties up floor plan for longer than the model in your head says. That is a financing cost, and at anything above trivial interest rates it is not a small one.
Rules of thumb are worse than no rule
You will hear numbers like "a dollar at the pump is worth X percent on big SUVs." Ignore them, for three reasons:
- The elasticity is not constant. A move from a low base is absorbed. The same absolute move from an already-high base, when it is straining household budgets, produces a much larger response
- Direction matters — see the asymmetry above. A single coefficient cannot represent both directions
- It is regional. Fuel prices, commute distances and vehicle mix vary enormously by state. A national average describes almost nobody's actual market
Which is why the answer is not a better rule of thumb. It is measuring your own segments, in your own region, from data you already have access to.
The four numbers worth tracking
If you want to see this coming rather than discovering it in an appraisal, these are the ones that matter, roughly in the order they move:
1. Retail asking prices by segment, in your region. The earliest signal, because a dealer changing an asking price is expressing a view before any transaction confirms it. Pulled from the marketplaces and dealer sites you compete against — that is what dealer inventory scraping is for.
2. Days-to-turn by body style. Listing appearance and disappearance dates give you this. It moves before price does, because dealers hold before they cut. A widening days-to-turn on one segment while the rest of the lot is stable is the clearest early warning there is.
3. Wholesale values by segment, week over week. MMR from Manheim is the standard reference, and the useful form is not a snapshot but a trend line per segment, so you can see the slope rather than a number. If you are not clear on what MMR represents and what it does not, start here.
4. The spread between retail asking and wholesale. This is the one almost nobody tracks and it is the most informative of the four, because it tells you whether a segment's move is a genuine demand shift or a temporary supply glut. A widening spread means retail has not yet followed wholesale down — which is either an opportunity or a warning depending on which side of the trade you are on.
None of that is exotic data. It is all in sources you either already subscribe to or can read publicly. The work is not obtaining it — it is getting it into one table, weekly, with the segments defined the way *your* lot is segmented rather than the way a national report segments it.
What that looks like built
A pipeline that runs weekly and produces one sheet:
- Row per segment, defined by you — not "SUV" but "full-size SUV, 2019–2022, under 80k"
- Wholesale value this week, last week, four weeks ago, and the slope
- Median retail asking price across your competitive set, and its slope
- Median days-to-turn, and its slope
- The retail-to-wholesale spread and whether it is widening or narrowing
- A flag when any segment's slope changes sign
That last line is the point of the entire exercise. You are not trying to read a dashboard every morning. You are trying to be told, once, when something you own has started behaving differently — and to be told in week two rather than week eight.
That is the same machinery as car auction automation: the data sources are ones you already have, and the build is the part that turns them into a table and an alert. It sits alongside pricing used cars against live market data, which covers the appraisal side of the same problem.
The honest limits
Fuel is one input among several, and often not the largest. Interest rates, off-lease supply volumes, new vehicle availability, tariffs, incentive changes and plain seasonality all move used values, sometimes hard enough to hide a fuel effect completely or to look exactly like one. A model that attributes every move in a truck segment to fuel prices will be confidently wrong on a regular basis.
This will not predict a fuel price. Nothing does, reliably, and anyone selling you a system that claims to is selling you something else. What it does is shorten your reaction time from weeks to days once a move has started — which is a smaller claim and an achievable one.
Correlation in your own data is still correlation. If trucks softened the same month fuel rose, rates also moved and so did off-lease volume. Treat the numbers as an early warning to look harder, not as an explanation.
Contact me at sam@autosmartcode.com if you want this built. Tell me the segments you actually stock, the region you buy and sell in, and which data you already subscribe to — MMR, an inventory feed, an auction account. I will tell you what is worth pulling, what you already have that you are not using, and what it would cost. Fixed price, quoted within 24 hours.